Which scope are you leaning toward for your kitchen?
Houzz's 2026 study found 52% of renovators changed the layout but 68% kept the footprint.
No votes yet. Yours will be the first. · saved on this device
Loading...
Kitchen Scopebook · Statistics
141 sourced data points on kitchen remodeling: what projects cost, what they return at resale, what homeowners choose, how many U.S. homes already have each feature by region, and 2 findings from Kitchen Scopebook's own analysis of federal household data. Every number links to where it came from.
These comparisons were calculated by Kitchen Scopebook from the Energy Information Administration's 2024 household survey microdata and the Census Bureau's new-housing tables. They answer questions the published reports don't break out.
Kitchen Scopebook analysis · 2024
95% interval 29.7%–32.8% · about 12.5 million homes · 5,529 survey households
95% interval 25.7%–28.6% · about 9.1 million homes · 4,491 survey households
Difference: 4.1 percentage points (95% interval 2.0 to 6.3).
Older houses tend to have older dishwashers, but only by a few points. Check the appliance itself rather than assuming the house's age tells you it's due for replacement.
Source: Kitchen Scopebook analysis of 2024 federal household survey data from the U.S. Energy Information Administration. How we calculated it
Kitchen Scopebook analysis · 2024
95% interval 5.9%–7.3% · about 2.5 million homes · 5,384 survey households
95% interval 3.4%–4.5% · about 2.0 million homes · 6,581 survey households
Difference: 2.6 percentage points (95% interval 1.7 to 3.6).
Induction is still uncommon, even in higher-income homes. If you're switching, plan for the 240-volt circuit and panel capacity, which most kitchens don't have yet.
Source: Kitchen Scopebook analysis of 2024 federal household survey data from the U.S. Energy Information Administration. How we calculated it
112.9% of cost recouped at resale by a minor midrange kitchen remodel (2025 Cost vs. Value report)
Zonda's 2025 Cost vs. Value report prices a minor midrange kitchen remodel (refaced cabinet fronts, new counters, sink, appliances and flooring) at a $28,458 national average job cost against $32,141 in resale value, the strongest return of any interior project it tracks.
Zonda / 2025 Cost vs. Value Report71% of cost a complete kitchen renovation recovers at sale, per Realtor estimates
NAR's 2025 Remodeling Impact Report estimates a complete kitchen renovation recovers 71% of its cost at sale and a minor kitchen upgrade 60%. These are Realtor estimates rather than appraisals, so they run more conservative than Cost vs. Value.
National Association of Realtors / 2025 Remodeling Impact Report10 / 10 Joy Score homeowners give a finished kitchen upgrade (NAR 2025)
The National Association of Realtors' 2025 Remodeling Impact Report assigns kitchen upgrades a Joy Score of 10 out of 10, the highest satisfaction rating homeowners report once a project is done.
National Association of Realtors / 2025 Remodeling Impact Report54% of remodelers used home equity loans or HELOCs to fund projects (NAR 2025)
NAR reports 54% of homeowners financed remodeling with home equity loans or lines of credit, compared with 29% from savings and 10% on credit cards. Arranging money before signing keeps a kitchen schedule from slipping while a lender processes paperwork.
National Association of Realtors / 2025 Remodeling Impact Report52% of Houzz kitchen renovators changed the layout; 68% kept the same footprint
Just over half of the kitchen renovators in Houzz's 2026 study reworked the layout, but 68% stayed inside the existing footprint and only 6% made the kitchen significantly larger. Moving the sink or range changes the scope far more than new finishes do.
Houzz / 2026 U.S. Houzz Kitchen Trends Study87% of Houzz kitchen renovators hired at least one professional; 98% on $50K+ jobs
Houzz found 87% of kitchen renovators hired a pro: 48% a general contractor, 34% a cabinetmaker and 22% a kitchen designer. On projects of $50,000 or more the share hiring professionals climbed to 98%.
Houzz / 2026 U.S. Houzz Kitchen Trends Study53% of Houzz kitchen renovators designed for current or future special needs
More than half of Houzz kitchen renovators planned for accessibility now or later; pull-out cabinets (59%), extra lighting (51%) and wide drawer pulls (44%) were the most common features chosen.
Houzz / 2026 U.S. Houzz Kitchen Trends Study58% of Houzz kitchen renovators added or upgraded an island; 52% of new islands exceed 7 ft
Islands showed up in most Houzz kitchen projects: 58% of renovators added or upgraded one, more than half of new islands ran longer than seven feet, and 78% were rectangular.
Houzz / 2025 U.S. Houzz Kitchen Trends Study37% of renovating homeowners went over budget in 2025 (Houzz & Home 2026)
the 2026 Houzz & Home Study found nearly two in five renovators overspent, most often by deliberately choosing higher-end materials (35%) or expanding scope mid-project (31%). Kitchens, with their long selection lists, are where both happen most.
Houzz / 2026 U.S. Houzz & Home Study34% of renovators used credit cards in 2025; 23% of $50K+ projects tapped home equity
Savings still fund 84% of renovations, but Houzz found credit card use rose five points to 34% in 2025. On budgets above $50,000, home equity loans (23%) and cash from a home sale (20%) come into play.
Houzz / 2026 U.S. Houzz & Home Study71% of homeowners who hired a pro prioritized preventive maintenance (Angi, 2025)
In Angi's April 2025 Home Spending Pulse, 71% of homeowners who had hired a pro in the previous year said they were prioritizing preventive maintenance.
Angi 2025 Home Spending Pulse54% of homeowners surveyed by Houzz renovated in 2025
The 2026 U.S. Houzz & Home Study found 54% of the homeowners it surveyed renovated during 2025, while 52% decorated and 47% made repairs. The sample is Houzz users, not all U.S. homeowners.
2026 U.S. Houzz & Home Study52% of homeowners surveyed by Houzz decorated in 2025
In the 2026 U.S. Houzz & Home Study, 52% of surveyed homeowners decorated during 2025, close to the 54% who renovated. Decorating is often the lower-cost alternative to a remodel.
2026 U.S. Houzz & Home Study47% of homeowners surveyed by Houzz made repairs in 2025
The 2026 U.S. Houzz & Home Study found 47% of surveyed homeowners made repairs during 2025, alongside the 54% who renovated and 52% who decorated.
2026 U.S. Houzz & Home Study50% of homeowners surveyed by Houzz planned to renovate in 2026
Half of the homeowners in the 2026 U.S. Houzz & Home Study said they planned a renovation during 2026, a pipeline that keeps good kitchen contractors and fabricators booked.
2026 U.S. Houzz & Home Study29% of homeowners who hired a pro bundled repairs to save money (Angi, 2025)
Angi's April 2025 Home Spending Pulse found 29% of homeowners who had hired a pro in the previous year bundled repairs together, a tactic that suits kitchen work because trades are already on site.
Angi 2025 Home Spending Pulse19% of homeowners who hired a pro chose cheaper materials or services (Angi, 2025)
In Angi's April 2025 Home Spending Pulse, 19% of homeowners who had hired a pro in the previous year selected cheaper materials or services to manage cost.
Angi 2025 Home Spending Pulse23% of homeowners who hired a pro started projects early to beat price rises (Angi)
Angi's April 2025 Home Spending Pulse found 23% of homeowners who had hired a pro in the previous year started projects early before expected price rises.
Angi 2025 Home Spending Pulse62% of homeowners who hired a pro grew more worried about upkeep costs (Angi, 2025)
In Angi's April 2025 Home Spending Pulse, 62% of homeowners who had hired a pro in the previous year reported increased concern about affording home maintenance.
Angi 2025 Home Spending Pulse48% of Realtors saw the biggest buyer-demand jump in kitchen upgrades
Nearly half of the Realtors NAR surveyed for its 2025 Remodeling Impact Report named kitchen upgrades as the project with the largest increase in buyer demand over the prior two years, ahead of every other interior project.
National Association of Realtors / 2025 Remodeling Impact Report35% of layout-changers ended with an L-shaped kitchen; 31% a U-shape, 14% a galley
Among Houzz homeowners who changed their layout, 35% landed on an L-shape, 31% a U-shape and 14% a galley. The L-shape leaves the most room for an island, which is why the two decisions get made together.
Houzz / 2026 U.S. Houzz Kitchen Trends Study80% of home buyers rate a walk-in pantry essential or desirable (NAHB 2024)
NAHB's What Home Buyers Really Want 2024, surveying more than 3,000 buyers, ranks a walk-in pantry and table space for eating (80% each) top among kitchen features, followed by a double sink (78%), pull-out shelves (74%) and a central island (74%).
NAHB / What Home Buyers Really Want 202415% of homeowners plan a $5,000+ kitchen remodel in the next 12 months (HIRI Q1 2026)
HIRI's Q1 2026 Homeowners Project Activity Tracker finds about 15% of homeowners planning a medium-to-large kitchen remodel; its 2025 Project Decision Study shows a $9,500 median and $16,023 average spend on such projects.
Home Improvement Research Institute (HIRI) (2026)$235B projected 2025 kitchen and bath industry revenue (NKBA / John Burns)
NKBA and John Burns Research forecast $235 billion in 2025 kitchen and bath revenue, up 0.8%, with professionally installed remodels growing 2.9% while DIY grows just 0.6%.
NKBA / 2025 Kitchen & Bath Market Outlook24% of renovating homeowners remodeled a kitchen in 2024 (Houzz & Home 2025)
Kitchens tied with guest bathrooms as the most common interior room renovated (24% each). The overall median kitchen spend was $22,000, and major remodels of small kitchens rose 9% to $35,000.
Houzz / 2025 U.S. Houzz & Home Study27% of improvement spending now comes from homeowners 65+, up from 14% (Harvard JCHS)
Harvard's Improving America's Housing 2025 finds owners 65 and over drove 27% of improvement outlays in 2023, versus 14% two decades earlier, as a $611 billion market stays roughly 50% above pre-pandemic levels.
Harvard JCHS / Improving America's Housing 202575% of occupied U.S. homes had a dishwasher in 2024 (installed stock, EIA RECS)
EIA's preliminary 2024 Residential Energy Consumption Survey microdata shows 99.5 million of occupied primary residences, 75.05%, with a dishwasher. This is installed stock, not annual purchases or remodels.
EIA / 2024 RECS preliminary household microdata47% of Houzz kitchen renovators added pantry cabinets (2026 Kitchen Trends)
Pantry cabinets were the most common built-in in the 2026 U.S. Houzz Kitchen Trends Study, added by 47% of surveyed kitchen renovators with projects in 2025–2026.
2026 U.S. Houzz Kitchen Trends Study76% of Houzz kitchen renovators added built-in features (2026 Kitchen Trends)
The 2026 U.S. Houzz Kitchen Trends Study, fielded in July 2025 among renovators with projects in 2025–2026, found 76% added built-in features such as pantry cabinets, beverage stations or seating.
2026 U.S. Houzz Kitchen Trends Study16% of Houzz kitchen renovators added a walk-in pantry (2026 Kitchen Trends)
Walk-in pantries appeared in 16% of kitchen projects in the 2026 U.S. Houzz Kitchen Trends Study, well behind pantry cabinets, because they need floor area.
2026 U.S. Houzz Kitchen Trends Study4.1 points higher 10+ yr-old dishwasher share, pre-1990 homes vs newer (our analysis)
Kitchen Scopebook's weighted analysis of the EIA's 2024 household survey microdata: among homes with a dishwasher, 31.3% of those built before 1990 ran one at least ten years old, against 27.1% of homes built 1990–2024, a 4.1-point gap. House age is not appliance age, so test the machine rather than using construction year as a replacement deadline.
Kitchen Scopebook analysis of EIA 2024 RECS household data2.6 points induction gap between owners earning $100k+ (6.6%) and under $100k (4.0%)
Kitchen Scopebook's weighted analysis of the EIA's 2024 household survey microdata: 6.6% of owner households with income of $100,000 or more cooked on induction, against 4.0% of owner households below $100,000, a 2.6-point gap. This is observed adoption, not a measure of what anyone can afford or why they chose it.
Kitchen Scopebook analysis of EIA 2024 RECS household data24% of Houzz kitchen renovators added a beverage station (2026 Kitchen Trends)
The 2026 U.S. Houzz Kitchen Trends Study found 24% of surveyed kitchen renovators added a beverage station, usually a run of cabinetry with its own counter and often an undercounter refrigerator.
2026 U.S. Houzz Kitchen Trends Study17% of Houzz kitchen renovators added a wine refrigerator (2026 Kitchen Trends)
The 2026 U.S. Houzz Kitchen Trends Study found 17% of surveyed kitchen renovators added a wine refrigerator, a built-in that needs its own cabinet opening and a dedicated outlet.
2026 U.S. Houzz Kitchen Trends Study14% of Houzz kitchen renovators added a breakfast bar (2026 Kitchen Trends)
The 2026 U.S. Houzz Kitchen Trends Study found 14% of surveyed kitchen renovators added a breakfast bar.
2026 U.S. Houzz Kitchen Trends Study9% of Houzz kitchen renovators added a baking station (2026 Kitchen Trends)
A dedicated baking station appeared in 9% of kitchen projects in the 2026 U.S. Houzz Kitchen Trends Study.
2026 U.S. Houzz Kitchen Trends Study7% of Houzz kitchen renovators added a butler's/prep pantry (2026 Kitchen Trends)
The 2026 U.S. Houzz Kitchen Trends Study found 7% of surveyed kitchen renovators added a butler's or prep pantry, a secondary work room that usually needs space borrowed from an adjacent room.
2026 U.S. Houzz Kitchen Trends Study67% of Houzz butler-pantry renovators included small-appliance storage
Among renovators who added a butler's or prep pantry in the 2026 U.S. Houzz Kitchen Trends Study, 67% included small-appliance storage, the most common feature of those rooms.
2026 U.S. Houzz Kitchen Trends Study61% of Houzz butler-pantry renovators included a prep counter
Among renovators who added a butler's or prep pantry in the 2026 U.S. Houzz Kitchen Trends Study, 61% included a prep counter.
2026 U.S. Houzz Kitchen Trends Study59% of Houzz butler-pantry renovators included enclosed cabinetry
Among renovators who added a butler's or prep pantry in the 2026 U.S. Houzz Kitchen Trends Study, 59% included enclosed cabinetry.
2026 U.S. Houzz Kitchen Trends Study52% of Houzz butler-pantry renovators included open shelving
Among renovators who added a butler's or prep pantry in the 2026 U.S. Houzz Kitchen Trends Study, 52% included open shelving.
2026 U.S. Houzz Kitchen Trends Study$55,000 median spend on a major kitchen remodel among Houzz renovators (2025 projects)
The 2026 Houzz Kitchen Trends Study, drawn from 1,780 homeowners surveyed in July 2025, puts the median major kitchen remodel at $55,000 and a minor remodel at $20,000. The top 10% of spenders on large kitchens reached $150,000. This is a platform sample, not a national average.
Houzz / 2026 U.S. Houzz Kitchen Trends Study$75,000 vs $46,000 median major remodel cost for kitchens 250+ sq ft versus smaller kitchens (Houzz)
Houzz's 2026 study found a major remodel of a kitchen 250 square feet or larger carried a $75,000 median, against $46,000 for smaller kitchens. Square footage is one of the first numbers to pin down before comparing any proposal.
Houzz / 2026 U.S. Houzz Kitchen Trends Study$26,945 average kitchen remodel cost, with a $14,589 to $41,559 typical range (HomeAdvisor)
Drawing on more than 10,000 surveyed customers, HomeAdvisor puts the average kitchen remodel at $26,945, or $75 to $250 per square foot. Minor remodels run $10,000 to $20,000 and total makeovers $65,000 to $130,000 or more.
HomeAdvisor / Kitchen Remodel Cost Guide (2026)~30% of a kitchen budget goes to cabinets; labor takes about 25% (HomeAdvisor)
HomeAdvisor's breakdown shows cabinetry consuming close to 30% of the total and labor around 25%. That is why refacing rather than replacing cabinets is the most common way to bring a quote down without shrinking the room.
HomeAdvisor / Kitchen Remodel Cost Guide (2025)$75 to $250 per square foot for a kitchen remodel, by size, materials and layout changes (HomeAdvisor)
HomeAdvisor's June 2026 cost guide prices a kitchen remodel at $75 to $250 per square foot, which it turns into size bands of $5,600 to $17,500 for a 75-square-foot kitchen, $7,500 to $25,000 for 100, $11,250 to $37,500 for 150 and $15,000 to $50,000 for 200.
HomeAdvisor / Kitchen Remodel Cost Guide (2026)$460 to $2,770 typical permit cost for a kitchen remodel, by scope and local rules (HomeAdvisor)
HomeAdvisor's June 2026 cost guide puts kitchen remodel permits at $460 to $2,770, depending on project scope and local building regulations. It is a national planning range; the actual fee schedule is set by the city or county.
HomeAdvisor / Kitchen Remodel Cost Guide (2026)$7,230 average cabinet refacing job; most pay $4,234 to $10,226 (HomeAdvisor)
HomeAdvisor's June 2026 refacing guide puts the average job at $7,230, with a typical range of $4,234 to $10,226 and $150 to $450 per linear foot depending on material. Small jobs start near $1,200 and large ones reach about $16,135.
HomeAdvisor / Cabinet Refacing Cost Guide (2026)$4,000 to $9,500 typical cabinet refacing cost, about $6,750 on average; labor is 50–70% of it (Modernize)
Modernize's August 2026 guide puts cabinet refacing at $4,000 to $9,500, around $6,750 on average, or $100 to $250 per linear foot, with labor making up 50% to 70% of the total project cost.
Modernize / Cabinet Refacing Cost (2026)$26,940 Angi national average from 13,100 verified kitchen projects ($14,588 to $41,550 range)
Angi's project data from 13,100 kitchen jobs completed by its pros lands at a $26,940 average, with most homeowners paying $14,588 to $41,550 depending on scope, materials and local labor. It is a national project mix, not a cabinet-only price or a local estimate.
Angi / How Much Does a Kitchen Remodel Cost (2026)$27,000 average kitchen remodel per Fixr; high-end jobs run $60,000 to $130,000
Fixr's 2026 cost guide puts the average at $27,000 (most pay $15,000 to $45,000), with cosmetic remodels at $10,000 to $25,000, midrange at $25,000 to $60,000 and high-end at $60,000 to $130,000.
Fixr / Kitchen Remodeling Cost Guide (2026)40% of a typical kitchen budget is cabinetry per Fixr; countertops take 14%
Fixr allocates 40% of a kitchen remodel budget to cabinetry, 18% to flooring, 14% to countertops, 11% to utilities and fixtures and 6% to appliances. Different guides split the pie differently, but cabinets lead every one of them.
Fixr / Kitchen Remodeling Cost Guide (2026)29% vs 28% wood-tone cabinets edged past white among Houzz kitchen renovators (2026 study)
Among renovating homeowners in the 2026 Houzz study, wood cabinets rose six points to 29% while white fell five points to 28%, ending white's long run as the default finish. That shift matters when you choose door fronts for refacing.
Houzz / 2026 U.S. Houzz Kitchen Trends Study68% of Houzz kitchen renovators replaced every cabinet; 27% did a partial upgrade
Roughly two-thirds of Houzz kitchen renovators replaced all cabinets, 27% did a partial upgrade (about half of those refinished exteriors and 20% swapped doors only) and only 5% left cabinets untouched.
Houzz / 2026 U.S. Houzz Kitchen Trends Study91% of Houzz kitchen renovators upgraded countertops; 85% cabinets and backsplash
Countertops were the most-replaced element in a kitchen remodel (91%), followed by backsplashes and cabinets (85% each) and full appliance replacement (51%), according to Houzz's 2025 study of 2024 projects.
Houzz / 2025 U.S. Houzz Kitchen Trends Study32% of upgraded countertops in Houzz's 2026 study were engineered quartz, the top choice
Engineered quartz leads countertop selections in Houzz's 2026 study at 32%, although its share has eased since 2024 as natural stone and butcher block regained ground among renovating homeowners.
Houzz / 2026 U.S. Houzz Kitchen Trends Study62% of kitchen designers expect quartz to remain the leading countertop (NKBA 2026)
NKBA's 2026 Kitchen Trends Report, built on 634 industry respondents, finds 62% expect quartz counters to stay on top, 51% name white oak the most popular cabinet wood, and 76% expect kitchen footprints to grow over the next three years.
NKBA / KBIS 2026 Kitchen Trends Report73% of buyers want granite or natural stone countertops (NAHB 2024)
Nearly three-quarters of recent and prospective buyers surveyed by NAHB rate a granite or natural stone countertop as essential or desirable, and 21 of 28 kitchen features it tested cleared the 50% mark.
NAHB / What Home Buyers Really Want 2024Over 90% crystalline silica in engineered stone, against 10–50% in granite and under 5% in marble (OSHA/NIOSH)
The February 2026 OSHA/NIOSH hazard alert on stone countertop fabrication lists engineered stone at over 90% crystalline silica, granite at 10% to 50% and marble or limestone under 5%. It directs shops toward wet cutting, wet-edge milling and HEPA vacuums to keep workers' exposure below OSHA's limit.
OSHA / NIOSH Hazard Alert, Publication 2026-10135% of Houzz kitchen renovators enlarged the footprint, most often from the dining room
About a third of Houzz renovators expanded the kitchen in 2024: 29% borrowed space from a dining room, 12% from a living room and 18% built an addition. Each of those routes can involve structural work that needs an engineer's sign-off.
Houzz / 2025 U.S. Houzz Kitchen Trends Study167,800 residential cooking fires in 2023, with 125 deaths and 2,500 injuries (USFA)
The U.S. Fire Administration counted 167,800 residential building cooking fires in 2023, causing 125 deaths, 2,500 injuries and $572.7 million in loss. Fires fell 11% over the decade, but cooking remains the reason clearances, ventilation and range placement are code items rather than style choices.
U.S. Fire Administration / Residential Building Cooking Fires (2024)67% of Houzz kitchen renovators installed LED lighting; 57% chose efficient appliances
Nine in ten Houzz kitchen renovators picked at least one sustainable option in 2024. LED lighting (67%) and energy-efficient appliances (57%) led, and 24% used low-VOC paints and finishes.
Houzz / 2025 U.S. Houzz Kitchen Trends Study2 in 3 kitchen designers expect induction to be the top cooktop type within three years
NKBA's 2025 Kitchen Trends Report (523 North American industry professionals) found two-thirds expect induction to become the most popular cooking type, and 52% see second islands gaining popularity. Induction changes the circuit an island or run needs.
NKBA / KBIS 2025 Kitchen Trends Report$50/yr to run an ENERGY STAR dishwasher; it saves about 8,400 gallons versus hand washing
ENERGY STAR says a certified dishwasher uses less than half the energy of washing by hand, saves roughly 8,400 gallons of water a year and trims utility bills by about $220 annually over its life.
ENERGY STAR / Dishwashers (2025)6 to 10 weeks of construction for a kitchen remodel; about four months including planning
HomeAdvisor estimates six to ten weeks of construction plus roughly four weeks of planning, so a full kitchen remodel stretches to about four months from first drawing to final walkthrough. Cabinet lead times often sit outside that window.
HomeAdvisor / Kitchen Remodel Cost Guide (2026)5.2% of occupied U.S. homes had induction in 2024; South highest at 6.2%
Kitchen Scopebook's weighted analysis of EIA 2024 RECS preliminary microdata (May 2026): 5.2% of occupied primary residences, about 6.9 million homes, had induction in a range or separate cooktop. Measured against homes with an electric range instead of all homes, the share is 8.0%, the base the site's state table uses. By region: Northeast 4.6%, Midwest 4.5%, South 6.2%, West 4.8%.
Kitchen Scopebook analysis of EIA 2024 RECS preliminary household microdata (May 2026)27.7% of occupied U.S. homes had a gas range in 2024; Northeast 40.4%, South 16.0%
Kitchen Scopebook's weighted analysis of EIA 2024 RECS preliminary microdata (May 2026): 27.7% of occupied primary residences, about 36.8 million homes, had a natural-gas range. Measured against homes that have a range, the share is 31.7%, the base the site's state table uses. By region: Northeast 40.4%, Midwest 31.1%, South 16.0%, West 35.2%.
Kitchen Scopebook analysis of EIA 2024 RECS preliminary household microdata (May 2026)51.7% of occupied U.S. homes had an electric range in 2024; South 63.0%
Kitchen Scopebook's weighted analysis of EIA 2024 RECS preliminary microdata (May 2026): 51.7% of occupied primary residences, about 68.6 million homes, had an electric range. By region: Northeast 39.6%, Midwest 52.8%, South 63.0%, West 40.4%.
Kitchen Scopebook analysis of EIA 2024 RECS preliminary household microdata (May 2026)20.6% of occupied U.S. homes ran a dishwasher 10+ years old in 2024; West highest
Kitchen Scopebook's weighted analysis of EIA 2024 RECS preliminary microdata (May 2026): 20.6% of occupied primary residences, about 27.3 million homes, had a dishwasher at least ten years old. By region: Northeast 19.2%, Midwest 20.0%, South 20.5%, West 22.6%.
Kitchen Scopebook analysis of EIA 2024 RECS preliminary household microdata (May 2026)26.6% of occupied U.S. homes ran a main refrigerator 10+ years old in 2024
Kitchen Scopebook's weighted analysis of EIA 2024 RECS preliminary microdata (May 2026): 26.6% of occupied primary residences, about 35.3 million homes, had a primary refrigerator at least ten years old. By region: Northeast 27.8%, Midwest 28.4%, South 24.7%, West 27.3%.
Kitchen Scopebook analysis of EIA 2024 RECS preliminary household microdata (May 2026)40.4% of occupied Northeast homes had a natural-gas range in 2024 (EIA RECS regional)
EIA's preliminary 2024 RECS shows 9.3 million Northeast occupied primary residences (40.37%) with a gas range, the highest regional share, against 15.98% in the South. Regional fuel mix shapes which appliance swaps are simple and which need new service.
EIA / 2024 RECS preliminary household microdata16.0% of occupied Southern homes had a natural-gas range in 2024 (EIA RECS regional)
Only 8.2 million occupied primary residences in the South (15.98%) cooked on natural gas in EIA's preliminary 2024 RECS, while 63.05% used an electric range. Southern kitchens are far more likely to already have the 240-volt circuit an induction range needs.
EIA / 2024 RECS preliminary household microdata67.5% of occupied Northeast homes had a dishwasher in 2024, the lowest regional share
EIA's preliminary 2024 RECS puts dishwasher ownership at 67.5% of occupied Northeast primary residences, versus 78.63% in the South and 77.93% in the West. Older Northeast housing stock is where adding a dishwasher during a remodel most often means new plumbing and a new circuit.
EIA / 2024 RECS preliminary household microdata16.4% of occupied U.S. homes used a wall oven in 2024; West 20.6%, Midwest 11.5%
Kitchen Scopebook's weighted analysis of EIA 2024 RECS preliminary microdata (May 2026): 16.4% of occupied primary residences, about 21.7 million homes, used a wall oven. By region: Northeast 11.6%, Midwest 11.5%, South 18.8%, West 20.6%.
Kitchen Scopebook analysis of EIA 2024 RECS preliminary household microdata (May 2026)75.1% of occupied U.S. homes had a dishwasher in 2024; Northeast lowest at 67.5%
Kitchen Scopebook's weighted analysis of EIA 2024 RECS preliminary microdata (May 2026): 75.1% of occupied primary residences, about 99.5 million homes, had a dishwasher. By region: Northeast 67.5%, Midwest 71.7%, South 78.6%, West 77.9%. Installed stock, not annual purchases.
Kitchen Scopebook analysis of EIA 2024 RECS preliminary household microdata (May 2026)5.4% of occupied U.S. homes had a wine chiller in 2024; West highest at 7.0%
Kitchen Scopebook's weighted analysis of EIA 2024 RECS preliminary microdata (May 2026): 5.4% of occupied primary residences, about 7.1 million homes, had a wine chiller. By region: Northeast 4.7%, Midwest 3.8%, South 5.6%, West 7.0%. Installed stock, not annual purchases.
Kitchen Scopebook analysis of EIA 2024 RECS preliminary household microdata (May 2026)Homes cooking on a natural-gas range: 31.7% nationally. Highest in New Jersey (64.4%), California (60.6%), Illinois (59%); lowest in Florida (5.1%), Hawaii (6.2%), North Carolina (8.5%).
Homes with an induction cooktop: 8% nationally. Highest in District of Columbia (14.1%), California (12.3%), Minnesota (11.5%); lowest in North Carolina (5.5%), Alabama (5.8%), Tennessee (6.1%).
Homes with a dishwasher: 75.1% nationally. Highest in Utah (91.5%), Colorado (88.5%), Nevada (86.3%); lowest in Hawaii (42.6%), New York (61.1%), West Virginia (62.1%).
Kitchen Scopebook calculated these state estimates from the Energy Information Administration's 2024 household survey microdata. EIA publishes the 2024 survey nationally and by region, not by state. Shares are weighted; a dash means the state sample was too small for a reliable estimate (fewer than 100 households, fewer than 10 yes answers, or a relative standard error above 30%). Source data.
| State | Homes cooking on a natural-gas range | Homes with an induction cooktop | Homes with a dishwasher |
|---|---|---|---|
| United States | 31.7% | 8% | 75.1% |
| Alabama | 14.4% | 5.8% | 76.3% |
| Alaska | 31.7% | — | 72.3% |
| Arizona | 30.8% | 8.9% | 83.6% |
| Arkansas | 19.2% | 10.3% | 72.3% |
| California | 60.6% | 12.3% | 72.3% |
| Colorado | 21.4% | 8% | 88.5% |
| Connecticut | 23% | 8.7% | 70.6% |
| Delaware | 23.5% | — | 80.7% |
| District of Columbia | 46.2% | 14.1% | 76% |
| Florida | 5.1% | 9.2% | 83.7% |
| Georgia | 25.4% | — | 81.2% |
| Hawaii | 6.2% | 10.9% | 42.6% |
| Idaho | 20.8% | — | 83% |
| Illinois | 59% | — | 72.2% |
| Indiana | 29.9% | — | 71.9% |
| Iowa | 25.6% | — | 71.4% |
| Kansas | 20% | — | 73.3% |
| Kentucky | 13.6% | — | 68.5% |
| Louisiana | 31.5% | — | 69.5% |
| Maine | — | — | 62.5% |
| Maryland | 35.9% | 11% | 84.1% |
| Massachusetts | 39.2% | 10.2% | 77.8% |
| Michigan | 35.3% | — | 72.7% |
| Minnesota | 32.6% | 11.5% | 82% |
| Mississippi | 17% | — | 70.3% |
| Missouri | 20.1% | 9.8% | 73.1% |
| Montana | 19.9% | — | 75.8% |
| Nebraska | 13.6% | — | 80% |
| Nevada | 52.2% | — | 86.3% |
| New Hampshire | 12.9% | — | 74.7% |
| New Jersey | 64.4% | — | 70.5% |
| New Mexico | 47.6% | — | 69.7% |
| New York | 53.4% | 10.8% | 61.1% |
| North Carolina | 8.5% | 5.5% | 78.3% |
| North Dakota | 11.9% | — | 85.2% |
| Ohio | 32.7% | 7.8% | 62.6% |
| Oklahoma | 33.1% | — | 76.9% |
| Oregon | 21.4% | — | 83.8% |
| Pennsylvania | 37.5% | 8.2% | 68.2% |
| Rhode Island | 35.4% | 9.3% | 67.1% |
| South Carolina | 11.6% | — | 80% |
| South Dakota | 16.1% | — | 82.6% |
| Tennessee | 13.5% | 6.1% | 77.8% |
| Texas | 26.6% | 8% | 78.1% |
| Utah | 29.9% | — | 91.5% |
| Vermont | 9.2% | — | 71.8% |
| Virginia | 23.1% | 7.7% | 81.3% |
| Washington | 14.7% | 10.8% | 84.9% |
| West Virginia | 21.6% | — | 62.1% |
| Wisconsin | 27.5% | — | 68.4% |
| Wyoming | 29.3% | — | 75.7% |
How many existing homes already have the features that shape a kitchen remodeling project, nationally and in each census region. Kitchen Scopebook weighted these from the federal survey records; counts are rounded.
| Measure | U.S. | Northeast | Midwest | South | West | Source |
|---|---|---|---|---|---|---|
| Homes with a dishwasher2024 · occupied primary-residence housing units | 75.1% | 67.5% | 71.7% | 78.6% | 77.9% | U.S. Energy Information Administration |
| Homes with a dishwasher at least 10 years old2024 · occupied primary-residence housing units | 20.6% | 19.2% | 20.0% | 20.5% | 22.6% | U.S. Energy Information Administration |
| Homes with a primary refrigerator at least 10 years old2024 · occupied primary-residence housing units | 26.6% | 27.8% | 28.4% | 24.7% | 27.3% | U.S. Energy Information Administration |
| Homes with a wine chiller2024 · occupied primary-residence housing units | 5.4% | 4.7% | 3.8% | 5.6% | 7.0% | U.S. Energy Information Administration |
| Homes using a wall oven2024 · occupied primary-residence housing units | 16.4% | 11.6% | 11.5% | 18.7% | 20.6% | U.S. Energy Information Administration |
| Homes with induction in a range or separate cooktop2024 · occupied primary-residence housing units | 5.2% | 4.6% | 4.5% | 6.2% | 4.8% | U.S. Energy Information Administration |
| Homes with a natural-gas range2024 · occupied primary-residence housing units | 27.7% | 40.4% | 31.1% | 16.0% | 35.2% | U.S. Energy Information Administration |
| Homes with an electric range2024 · occupied primary-residence housing units | 51.7% | 39.6% | 52.8% | 63.0% | 40.4% | U.S. Energy Information Administration |
Published figures come from Zonda / 2025 Cost vs. Value Report, National Association of Realtors / 2025 Remodeling Impact Report, Houzz / 2026 U.S. Houzz Kitchen Trends Study, Houzz / 2025 U.S. Houzz Kitchen Trends Study, NKBA / KBIS 2026 Kitchen Trends Report, NKBA / KBIS 2025 Kitchen Trends Report, NAHB / What Home Buyers Really Want 2024, HomeAdvisor / Kitchen Remodel Cost Guide and other named sources, each linked where it appears. Housing data by region is Kitchen Scopebook's weighted tabulation of the EIA's 2024 Residential Energy Consumption Survey public microdata, using the survey's own weights and 60 replicate weights for the intervals, and of the Census Bureau's Characteristics of New Housing tables. Figures describe the period and population shown next to each one.
Homeowner polls
Houzz's 2026 study found 52% of renovators changed the layout but 68% kept the footprint.
No votes yet. Yours will be the first. · saved on this device
No votes yet. Yours will be the first. · saved on this device
Angi's national average is $26,940; Houzz's major-remodel median is $55,000.
No votes yet. Yours will be the first. · saved on this device
75.1% nationally in 2024 (about 99.5M housing units), based on Kitchen Scopebook's weighted analysis of EIA 2024 RECS preliminary household microdata (May 2026). The share is highest in the South at 78.6% and lowest in the Northeast at 67.5%. The figure covers occupied primary-residence housing units.
20.6% nationally in 2024 (about 27.3M housing units), based on Kitchen Scopebook's weighted analysis of EIA 2024 RECS preliminary household microdata (May 2026). The share is highest in the West at 22.6% and lowest in the Northeast at 19.2%. The figure covers occupied primary-residence housing units.
26.6% nationally in 2024 (about 35.3M housing units), based on Kitchen Scopebook's weighted analysis of EIA 2024 RECS preliminary household microdata (May 2026). The share is highest in the Midwest at 28.4% and lowest in the South at 24.7%. The figure covers occupied primary-residence housing units.
5.4% nationally in 2024 (about 7.1M housing units), based on Kitchen Scopebook's weighted analysis of EIA 2024 RECS preliminary household microdata (May 2026). The share is highest in the West at 7.0% and lowest in the Midwest at 3.8%. The figure covers occupied primary-residence housing units.
16.4% nationally in 2024 (about 21.7M housing units), based on Kitchen Scopebook's weighted analysis of EIA 2024 RECS preliminary household microdata (May 2026). The share is highest in the West at 20.6% and lowest in the Midwest at 11.5%. The figure covers occupied primary-residence housing units.
Older houses tend to have older dishwashers, but only by a few points. Check the appliance itself rather than assuming the house's age tells you it's due for replacement. Kitchen Scopebook calculated this from the federal government's 2024 household survey data: owner-occupied dishwasher homes built before 1990 31.3% versus owner-occupied dishwasher homes built in 1990–2024 27.1%.
Induction is still uncommon, even in higher-income homes. If you're switching, plan for the 240-volt circuit and panel capacity, which most kitchens don't have yet. Kitchen Scopebook calculated this from the federal government's 2024 household survey data: owner households with income of $100,000 or more 6.6% versus owner households with income below $100,000 4.0%.
112.9%. Zonda's 2025 Cost vs. Value report prices a minor midrange kitchen remodel (refaced cabinet fronts, new counters, sink, appliances and flooring) at a $28,458 national average job cost against $32,141 in resale value, the strongest return of any interior project it tracks. Source: Zonda / 2025 Cost vs. Value Report.
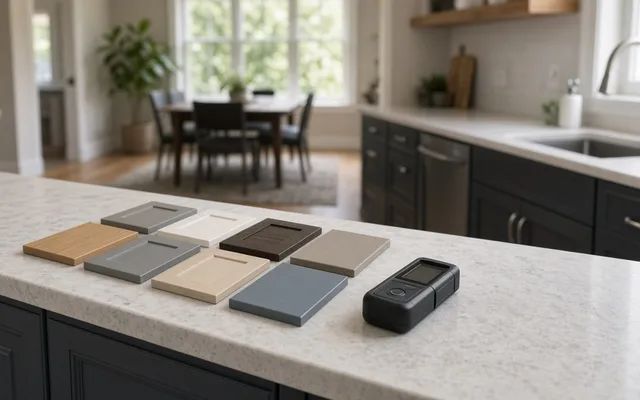 Free toolKitchen remodel cost calculator
Size, material tier and complexity in, a realistic budget range out.
 Free toolKitchen comparisons: the five decisions that move the budget
Side-by-side tables for the decisions that change the price most.
 Free toolKitchen remodel quiz: find your scope and check the numbers
10 questions that show what you already know and what to check next.
 Free toolKitchen remodel polls: see what other homeowners are choosing
See what other planners chose and add your vote.
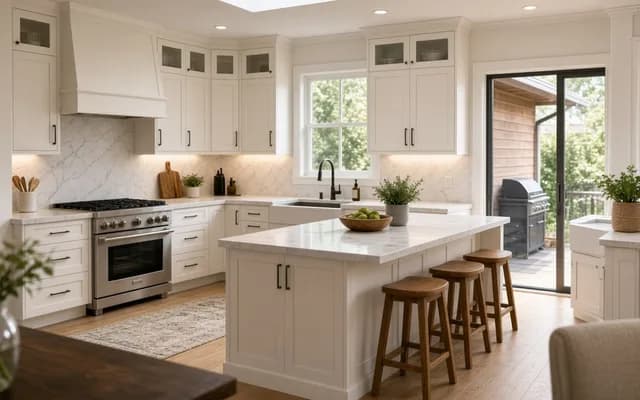 Service guideComplete Kitchen Renovation
A complete kitchen renovation replaces cabinets, counters, flooring, lighting and usually appliances under a single plan, and may relocate plumbing, gas and electrical or remove a wall.
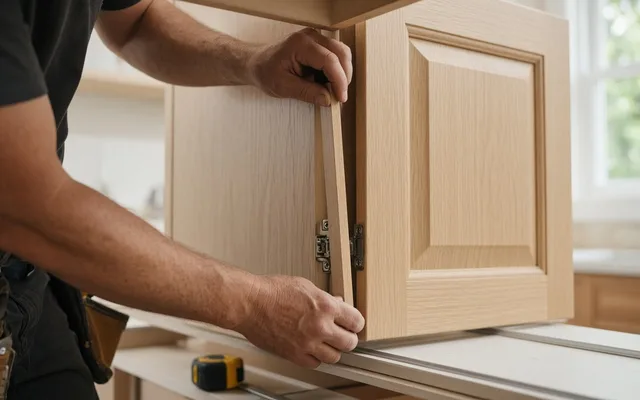 Service guideCabinet Refacing & Installation
Cabinet refacing replaces doors, drawer fronts and hardware and covers the exposed box faces with matching veneer, leaving the layout unchanged.
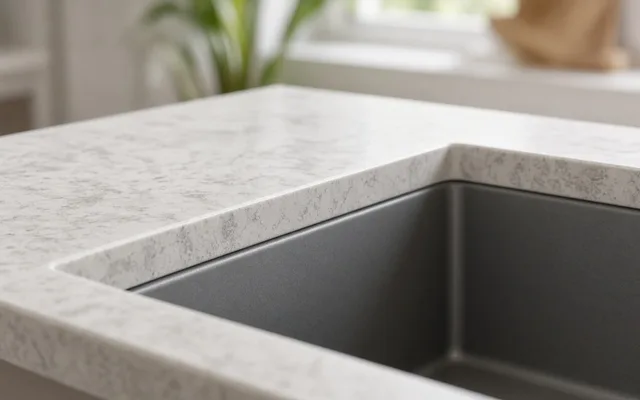 Service guideCountertop Installation
Countertop installation replaces the work surface, sink and often the backsplash on cabinets you keep.
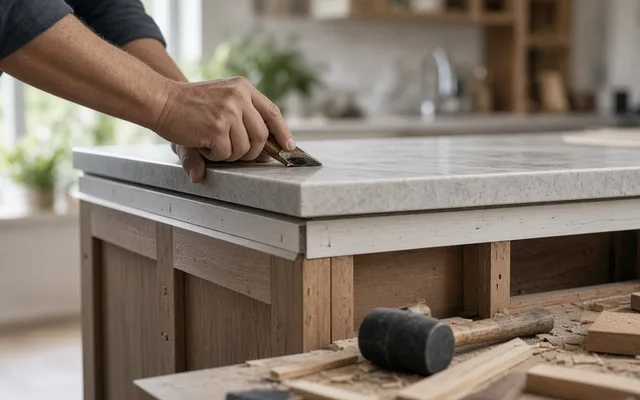 Service guideKitchen Island Design & Build
A kitchen island is a freestanding cabinet unit with its own countertop, often with seating, storage, a sink or a cooktop.
Tell us the size, the condition of what is there now, and what you want to change. Kitchen Scopebook passes your request to independent local professionals, who reply with written, no-obligation estimates. The service is free to use.